Solar Production
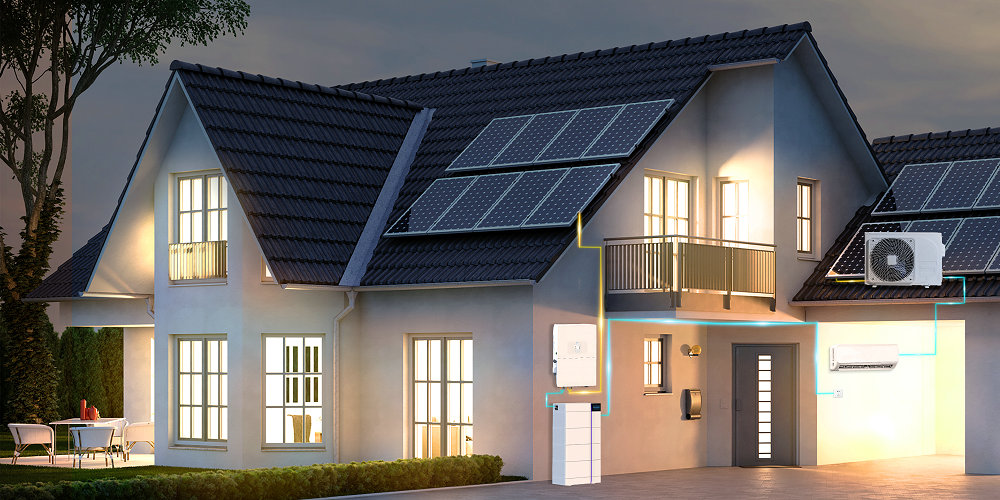
The amount of solar production you can expect from your solar panel system installed in Ontario can vary depending on factors such as the size of your system, the direction and pitch of your roof, and the amount of sunlight your area receives each month. However, we can provide an estimate of how much solar production you can expect in each month based on average data.

Annual South facing Latitude Tilt
According to the National Renewable Energy Laboratory, the average solar insolation (sunlight) in Ontario ranges from 3.4 kWh/m²/day in December to 6.2 kWh/m²/day in July. This means that, on average, your solar panels will produce more electricity in the summer months than in the winter months.
Assuming you have a 5 kW solar panel system installed on your roof in Ontario, you can expect to generate approximately 500 kWh of electricity per month on average. However, your solar production will vary each month depending on the amount of sunlight available. Here’s a breakdown of how much solar production you can expect in each month:
- January: 300-350 kWh
- February: 350-400 kWh
- March: 450-500 kWh
- April: 500-550 kWh
- May: 550-600 kWh
- June: 600-650 kWh
- July: 650-700 kWh
- August: 600-650 kWh
- September: 500-550 kWh
- October: 400-450 kWh
- November: 300-350 kWh
- December: 250-300 kWh
It’s important to note that these estimates are based on average data and your actual solar production may vary. Factors such as shading, roof orientation, and weather conditions can all impact your solar production. However, this should give you a general idea of how much electricity you can expect to generate each month from your solar panel system in Ontario. To get a more accurate estimate of your solar production, consult with a professional solar installer who can assess your home’s specific needs and provide a customized quote.
Recent Posts
Mar. 03, 2024
Can I get paid to have Solar Panels in Ottawa?

Feb. 25, 2024
How much do Electricians cost in Ottawa?

Feb. 22, 2024
Harnessing Solar Power in Ottawa: A Comprehensive Guide to Solar Panels for Homeowners
Feb. 18, 2024
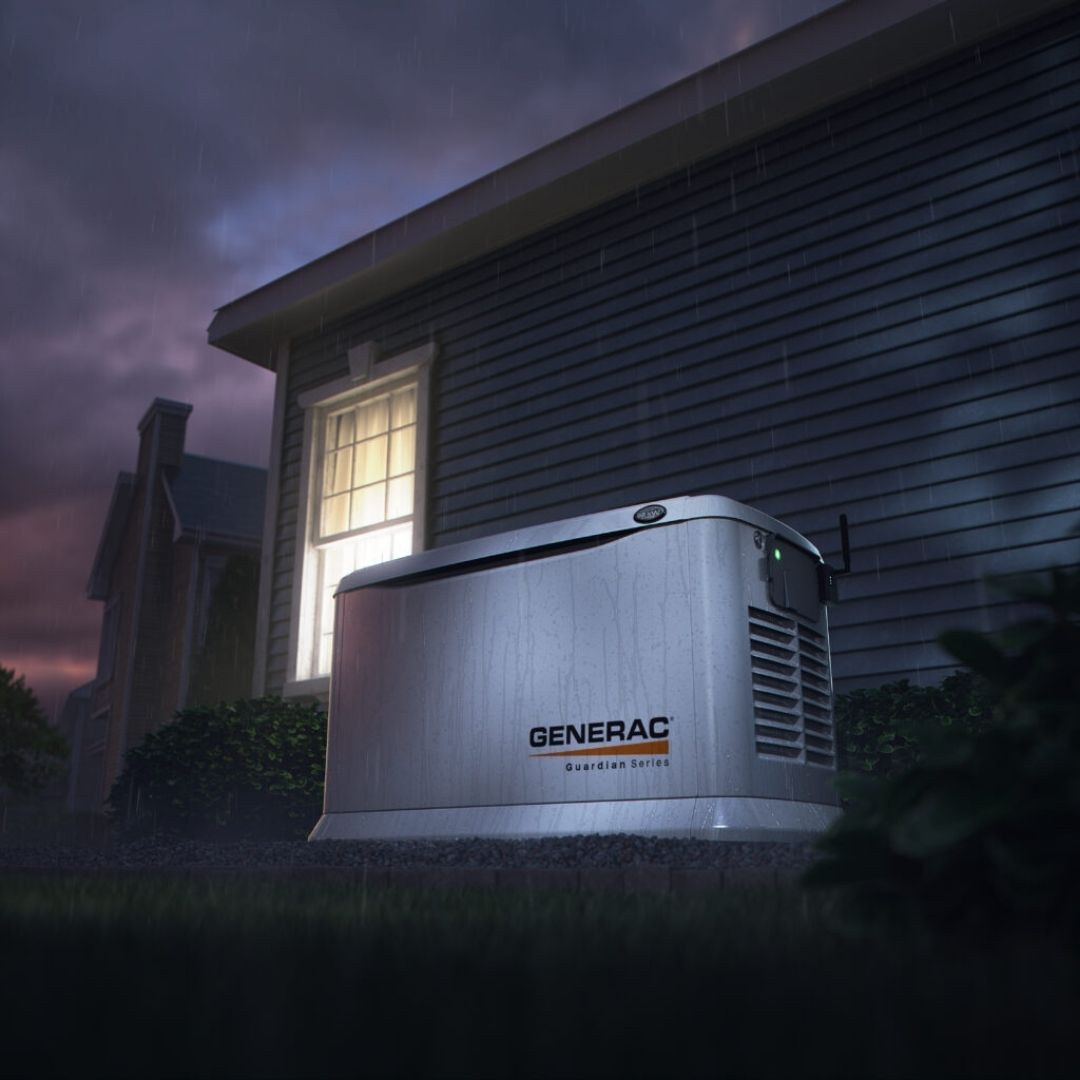
Generac Generators: Powering Peace of Mind in Ottawa

Jun. 10, 2023
Micro Inverters vs DC optimizers
View More